# Calculate the average income for each state
av_income_by_state = household.group_by(household.ST).aggregate(total_income = household.HINCP.mean())
av_income_by_statePart 4 – Using Ibis With SnowflakeDB
This the website for the workshop “Larger Than Memory Data Workflows with Apache Arrow and Ibis” taught at the J on The Beach conference on May 10th, 2023.
Learning Objectives
Working with Remote Data
Learning objectives
- Connect to Snowflake database
- Show how the same Python code can be reused with different backend
- Make a table and convert it into a local parquet file.
Note
Because you would need to create a SnowflakeDB account and upload data to it we encourage you to carry out this section at home after the workshop. The intstructor will walk you through this, so feel free to ask questions!
Introduction to SnowflakeDB
What is SnowflakeDB?
- Snowflake is a cloud-based data warehousing and analytics platform
- It uses SQL as the platform language to query data stored on the platform
- Great for centralising big data in the cloud
For this workshop we will use the Ibis SnowflakeDB backend to query PUMS data stored in the cloud.
We’ll write some code in Ibis using the default DuckDB backend and then switch to the SnowflakeDB backend and use the same code to query the data in the cloud. The ability to switch between backends and use the same code is excellent for prototyping code on a smaller dataset then scaling to a larger one in the cloud.
Calculate Average Income by State
First let’s do this using the default DuckDB backend
Create a bar chart with the average income by state. Use a groupby to get the mean household income by state
Get the state names and abbreviations with corresponding codes
states = ibis.read_csv('pums_states.csv')
states.head(5)
Join the two tables and order the data by descending total_income
average_income_by_state = av_income_by_state.outer_join(states, av_income_by_state.ST == states.pums_code)
average_income_by_state = average_income_by_state.drop('pums_code').order_by(ibis.desc(_.total_income))

average_income_by_state
Plot the data (first 10 states)
import matplotlib.pyplot as plt

av_income_by_state = average_income_by_state.head(10).execute()

# #get the state abbreviations instead of full names
# names = [name for name in av_income_by_state.state]

fig = plt.figure()
ax = fig.add_axes([0,0,1,1])
ax.bar(av_income_by_state.state,av_income_by_state.total_income, color=(0.0, 0.196, 0.196, 1.0))

plt.show()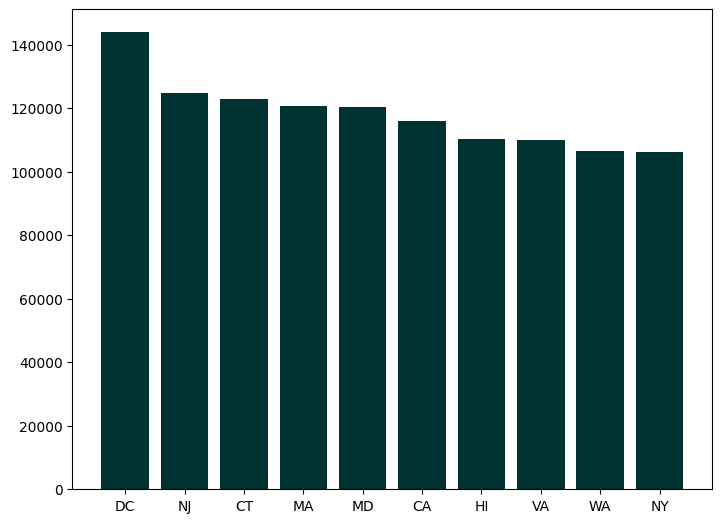
Switch to the SnowflakeDB backend and analyse PUMS data stored remotely with the same code
Connect to the SnowflakeDB PUMS database
con = ibis.connect(
    "snowflake://username:password@account/MY_PUMS/MY_PUMS_SCHEMA"
)
print the names of the tables in the database
con.tablesconnect to the household table and preview it
household = con.tables.HOUSEHOLD

household.head()
Run the same code we used above but now on a table in the cloud
# Calculate the average income for each state
av_income_by_state = household.group_by(household.ST).aggregate(total_income = household.HINCP.mean())

states = ibis.read_csv('pums_states.csv')

average_income_by_state = av_income_by_state.outer_join(states, av_income_by_state.ST == states.pums_code)
average_income_by_state = average_income_by_state.drop('pums_code').order_by(ibis.desc(_.total_income))

import matplotlib.pyplot as plt

av_income_by_state = average_income_by_state.head(10).execute()

# #get the state abbreviations instead of full names
# names = [name for name in av_income_by_state.state]

fig = plt.figure()
ax = fig.add_axes([0,0,1,1])
ax.bar(av_income_by_state.state,av_income_by_state.total_income, color=(0.0, 0.196, 0.196, 1.0))

plt.show()
Conclusion
That’s all for today’s workshop! Thank you for joining us. If you have any questions don’t hesitate to reach out to us at:
- marlene@voltrondata.com
- francois@voltrondata.com
We hope you found this helpful!